With advancements in scientific research, especially the rapid improvements in computational and data processing capabilities, research methods for the nervous system are also evolving. In this context, technology giants like Google have begun investing in this field, applying advanced technologies to neuroscience research, thereby driving the rapid development of connectomics. Scientists have now mapped detailed connectomes of various organisms’ brains, rapidly changing our understanding of brain functioning.
Ten years ago, Google started focusing on AI innovations and collaborating with large datasets, thereby establishing a connectomics team. In reconstructing brain structures, they generated massive amounts of data. To effectively handle this data, the Google team developed the flood-filling networks (FFN) model to replace the traditional manual method of annotating cells in images [1]. These networks can automatically reconstruct neurons through tissue layers. Based on this, Google developed the SegCLR algorithm to automatically identify different parts and cell types within these networks [2]. The Google connectomics team also created TensorStore [3], an open-source C++ and Python software library for storing and managing large multidimensional datasets. This tool has achieved functionality far beyond connectomics and is now widely used at Google and in the broader machine learning community.
In 2018, Google partnered with the Max Planck Institute for Neurobiology in Germany to develop a deep learning-based system that can automatically map brain neurons [1]. They reconstructed the scanned images of one million cubic micrometers of a zebra finch brain.
▷ Illustration of segmenting each neuron in a small part of the zebra finch brain using FFN. Source: google.
In 2019, Google collaborated with the Howard Hughes Medical Institute and the University of Cambridge, using the FFN model and TPU chips to slice a fruit fly brain into thousands of 40-nanometer ultra-thin sections. They used a transmission electron microscope to generate images of each slice, producing over 40 trillion pixels of fruit fly brain images. These 2D images were then aligned to reconstruct a complete 3D image of the fruit fly brain [4]. In 2020, Google released the fruit fly hemibrain connectome, which included images covering 25,000 neurons and revealed their synaptic connections, accounting for about one-third of the fruit fly brain by volume [5].
▷ Fruit fly hemibrain connectome.
Recently, Google collaborated with the Lichtman Laboratory at Harvard University to publish an article in Science titled “A petavoxel fragment of human cerebral cortex reconstructed at nanoscale resolution.”
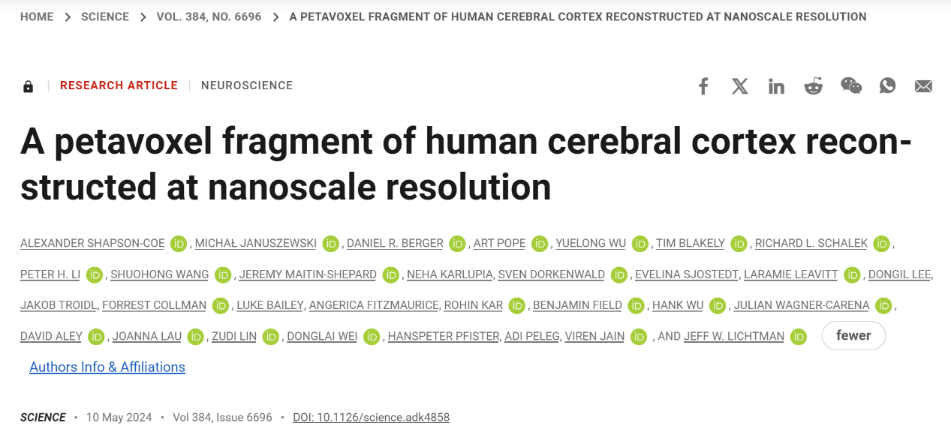
▷ Shapson-Coe, Alexander, et al. “A petavoxel fragment of human cerebral cortex reconstructed at nanoscale resolution.” Science 384.6696 (2024): eadk4858.
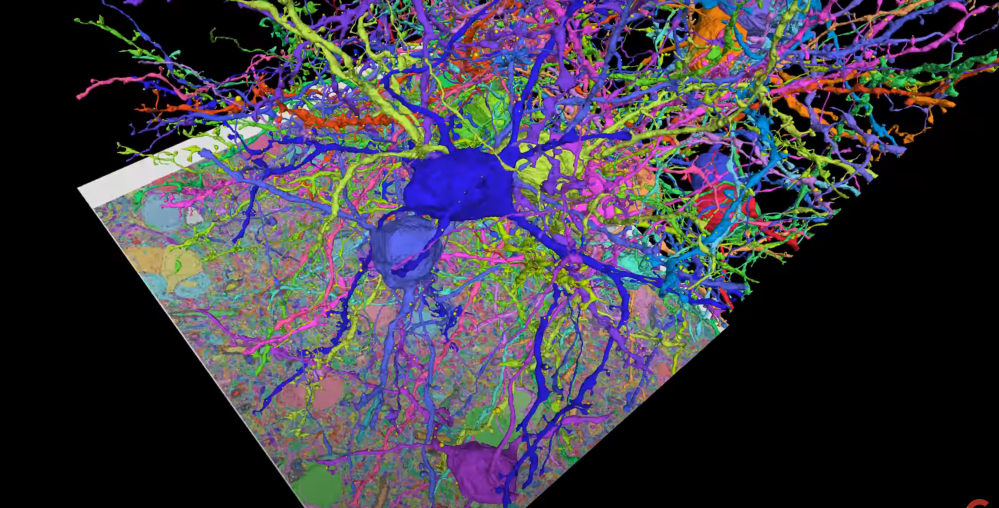
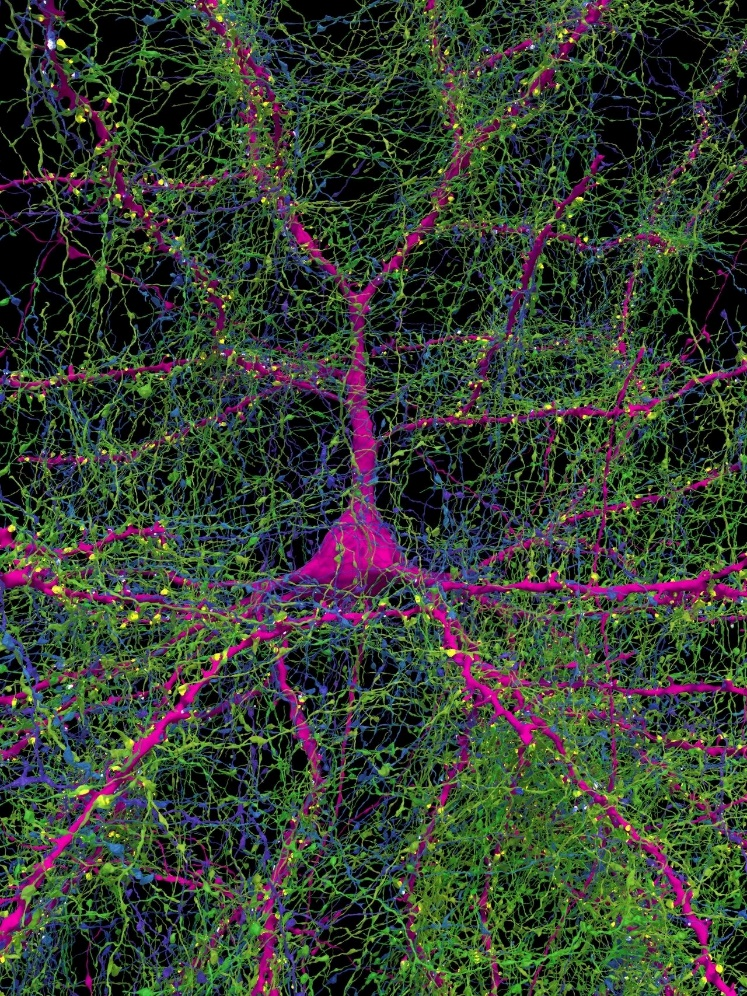
This study released the latest H01 dataset, a 1.4 PB rendered image of a small sample of human brain tissue. The H01 sample was imaged at a resolution of 4nm using serial section electron microscopy and then reconstructed and annotated through automated computational techniques, ultimately revealing the preliminary structure of the human cerebral cortex. The H01 dataset is not only the largest sample of its kind imaged and reconstructed to this extent in any organism, but it is also the first large-scale sample to study the synaptic connectivity of the human cerebral cortex, spanning multiple cell types across all cortical layers.
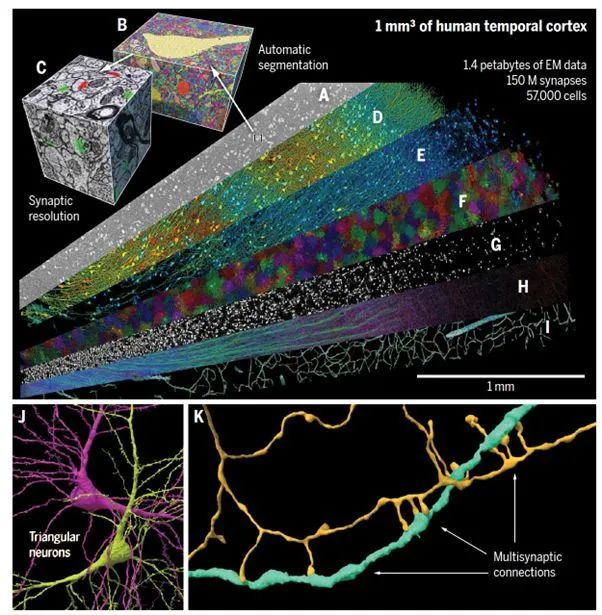
▷ Figure 1: The H01 dataset of the human cerebral cortex.
The research team encountered many obstacles in creating this image. One major issue was finding suitable brain tissue samples. Since the human brain begins to degrade rapidly after death, postmortem brain tissue is often unsuitable for research. Therefore, the team chose a tissue sample taken during brain surgery from an epilepsy patient, aiming to help control their seizures. Additionally, identifying the structure of neural circuits at the synaptic level requires higher resolution electron microscopy. Serial EM, with its automation and rapid imaging capabilities, can image cubic millimeter volumes of tissue at nanoscale resolution, making it a powerful tool for reconstructing the fine neural circuits of the human brain.
The outcomes of this work primarily include the following four aspects:
1.Reconstruction of Human Brain Samples and Neuron Connectivity
The human brain sample used in this study was taken from the left anterior temporal lobe of an epilepsy patient during surgery. The sample was about the size of half a grain of rice. After fixation, staining, and embedding, the sample was sectioned using an automatic tape-collecting ultramicrotome (ATUM), producing 5,019 tissue sections with an average thickness of 33.9 nm, totaling 0.170 mm in thickness. These sections were then placed on silicon wafers and imaged under a custom-built 61-beam parallel scanning electron microscope at a resolution of 4×4 nm², rapidly capturing images with a total imaging volume of 1.05 mm³. The raw data size of each section reached up to 350 terabytes, and the overall dataset size reached 1.4 petabytes.
The subsequent computational challenge was to analyze such a massive dataset. The researchers successfully addressed this issue using artificial intelligence algorithms. The team computationally stitched and aligned this data to generate a single 3D volume. Despite the overall high quality of the data, these alignment channels needed to be robust to handle challenges such as imaging artifacts, missing sections, variations in microscope parameters, and physical stretching and compression of the tissue. Once aligned, a multi-scale FFN (flood-filling network) algorithm, utilizing thousands of Google Cloud TPUs, was applied to generate 3D segmentations of each individual cell in the tissue. FFN is the first automated segmentation technique capable of producing sufficiently accurate reconstructions. Additionally, other machine learning pipelines were used to identify and annotate 130 million synapses, dividing each 3D segment into different “subregions” (e.g., axons, dendrites, or cell bodies) and identifying other structures of interest, such as myelin and cilia.
However, the results of automated reconstruction were not perfect. Given the massive amount of neuronal structural data, it was impractical for individual lab members to manually proofread the entire dataset. Therefore, researchers from Princeton University and the Allen Institute developed an online proofreading platform called CAVE (Connectome Annotation and Versioning Engine), as an extension of Neuroglancer. This platform allows users to proofread and update annotated data to improve the dataset as part of their research. Researchers can select specific neurons or their connections and manually refine and annotate their reconstructions. CAVE is already used for smaller datasets, including the fly connectome.
For this project, researchers updated the algorithms to handle such large datasets. The interface permits proofreading, which is a crucial final step in completing the connectome reconstruction. Anyone can apply to become a proofreader, and proofreaders can download data related to the cells they are working on for subsequent analysis. Additionally, VAST (Volume Annotation and Segmentation Tool) is available as a general free software for viewing, segmenting, and annotating large datasets. For diversified analysis, researchers also provided various databases allowing users to query cell and synapse data specifically. To support complex query conditions, they developed a standalone program called CREST (Connectome Reconstruction and Exploration Simple Tool), which identifies and explores cell connections based on many cell characteristics.
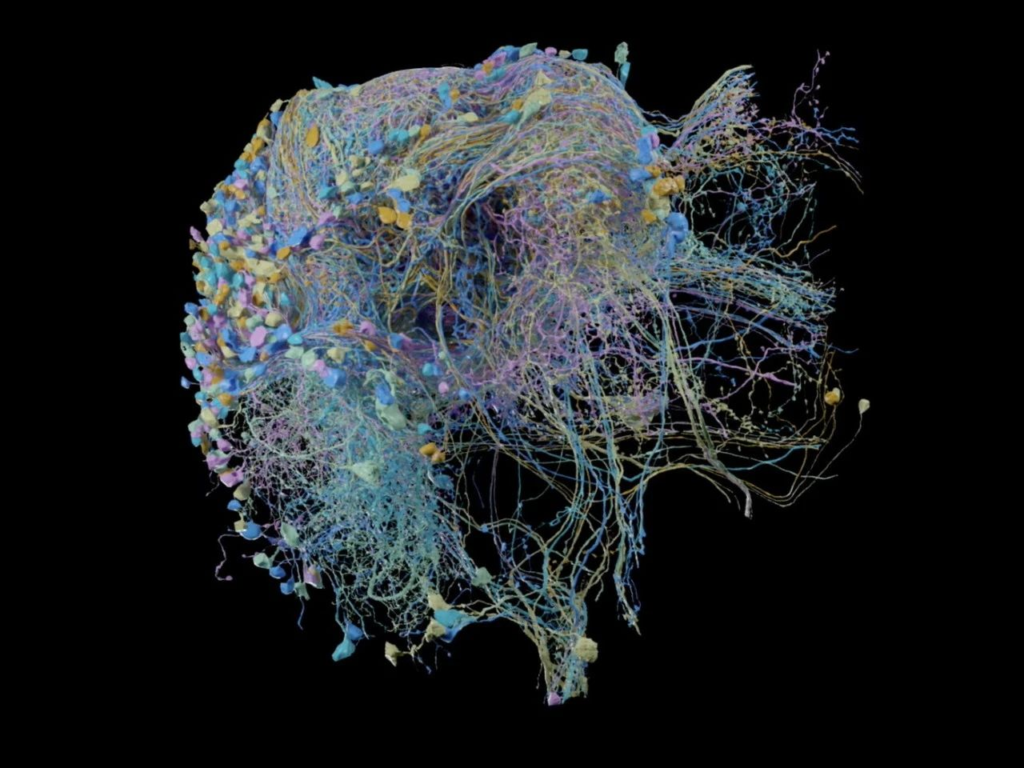
 ▷ Source: Viren Jain
2. Composition of Cells and Synapses in the Human Cerebral Cortex
Through identification and quantitative analysis of all nucleated cells in the sample, 49,080 neurons and glial cells, along with 8,100 vascular-related cells, were identified. The number of glial cells (32,315) was about twice that of neurons (16,087). These neurons were mainly divided into spiny (65.5%), non-spiny, and non-pyramidal types. The neuronal density in the human cerebral cortex is about 16,000/mm³, which is approximately one-third lower than previously estimated by optical microscopy in the human temporal cortex and nearly ten times lower than the density in the mouse associative cortex.
Based on the size and distribution density of the cell bodies, the researchers divided the sample into six cortical layers and white matter. The distribution of glial cells varied among these layers. Notably, protoplasmic astrocytes were densely distributed from layers 2 to 6. However, in the shallower part of layer 1, they tended to be more mixed, with higher density and smaller size. Fibrous astrocytes in the white matter were more elongated than those occupying the cortex. Two other types of glial cells, microglia and oligodendrocyte precursor cells (OPCs), had nearly uniform density across all layers. Another type of glial cell, oligodendrocytes (n=20,139), exhibited a gradient distribution, with the lowest density in the upper layers and the highest density in the white matter, likely related to their role in myelination. Microglia, OPCs, and oligodendrocytes all showed an affinity for blood vessels. A large number of myelinated axons were radially distributed between the white matter and the superficial cortical layers, horizontally distributed on two orthogonal axes. The reconstructed blood vessels did not show layer-specific distribution.
Synapses are the bridges of the neural network. The human brain has 86 billion neurons, and synapses allow the transmission of electrical signals from one neuron to the next. To identify synaptic sites, the researchers trained a classifier based on the U-Net architecture to label three categories: background, presynaptic, and postsynaptic. They also trained a binary ResNet-50 classifier to categorize each identified synapse as excitatory or inhibitory based on its electron microscopy appearance, postsynaptic structure type, and presynaptic neuron type (if known).
In the reconstructed human brain tissue, approximately 102.5 million (67.1%) synapses were identified as excitatory, and about 50.3 million (32.9%) as inhibitory (Fig.2). Further analysis showed that most of these synapses were located on dendrites (99.4%), with only a small portion on axon initial segments (0.2%) or cell bodies (0.4%). This data is accessible on the Neuroglancer platform. By analyzing the reconstructed synapses, the researchers found that excitatory synapses were mainly distributed in layers 1 and 3, while inhibitory synapses were predominantly found in layer 1. Additionally, the ratio of excitatory to inhibitory inputs received by pyramidal neurons and interneurons varied slightly across layers, reflecting the complex regulatory mechanisms of neural networks.
▷ Figure 2: Distribution of cells and synapses in the human cerebral cortex and white matter.
3.Morphological Subtypes of Layer 6 Triangular Neurons
The deeper layers of the cerebral cortex are less understood than the superficial layers due to the complexity and diversity of cell types present. In this study, the researchers focused on spiny neurons in the deep cortical layers, particularly triangular neurons, which are not well understood in primates. In the reconstructed human brain tissue, triangular neurons were predominantly located in layers 5 and 6 (n = 876), accounting for about one-third of the spiny neurons. These cells are characterized by their large basal dendrites extending from the soma in various directions, forming a notable directional distribution, thus referred to as “compass neurons.”
The study further distinguished two types of neurons based on the direction of their basal dendrites: one type with large basal dendrites extending anteriorly and another with large basal dendrites extending posteriorly at a mirror-symmetric angle. These two groups of cells formed a mirror-symmetric distribution in the cerebral white matter (Fig.3). Additionally, the direction of the basal dendrites exhibited a bimodal distribution, with most cells extending either significantly forward or markedly backward, while others were more tangentially oriented. The distribution of these basal dendrites corresponded to the functional regions of the cerebral cortex and might be related to the principal axis of the myelinated axons in the subjacent white matter. These neurons tended to cluster with nearest neighbor cells having the same orientation, suggesting that this spatial distribution is not random. The statistical correlation of these mirror-symmetric neurons indicates that such cell clustering might have some underlying, yet unclear, functional significance.
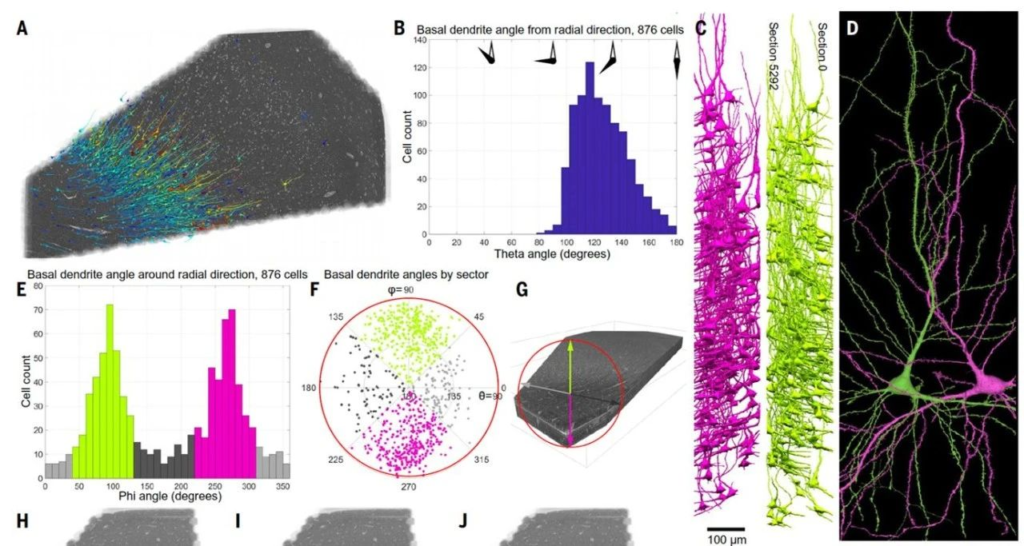
▷ Figure 3: Two mirror-symmetric subgroups of triangular neurons in the deep layers of the human cerebral cortex.
4.Multiple Synaptic Connections
Previous research has shown that axons in the rodent cerebral cortex occasionally form multiple synaptic connections on the same postsynaptic cell. To investigate whether the same phenomenon occurs in the human cerebral cortex, researchers used CREST to systematically identify strong connections in reconstructed human brain tissue. The results indicated that, in the human cerebral cortex, single axons occasionally establish multiple synapses on the same postsynaptic cell. Researchers systematically discovered this phenomenon in both excitatory and inhibitory axons. Although such strong connections are rare, they are extremely potent, with over 50 individual synaptic connections possible between pairs of neurons. Typically, 96.5% of axon-target cell contacts have only one synapse, while 0.092% of axon connections may have four or more synapses.
Furthermore, analysis of 2,743 neurons revealed that 39% of neurons had at least one dendritic input with seven or more synapses, indicating that strong axonal inputs are a common feature of human brain neurons. Interestingly, these multiple synaptic connections are often formed by axons maintaining close contact with dendrites over long distances (Fig.4).
The authors also explored whether the number of synapses established by an axon on target cells exceeded the expectations of a random model. The results showed that the incidence of strong connections observed was significantly higher than the model’s predictions (Fig.4). Although the phenomenon of single axons establishing multiple synapses on the same postsynaptic cell is uncommon in the human cerebral cortex, these rare, strong connections might be an important component of complex neuron-to-neuron communication.
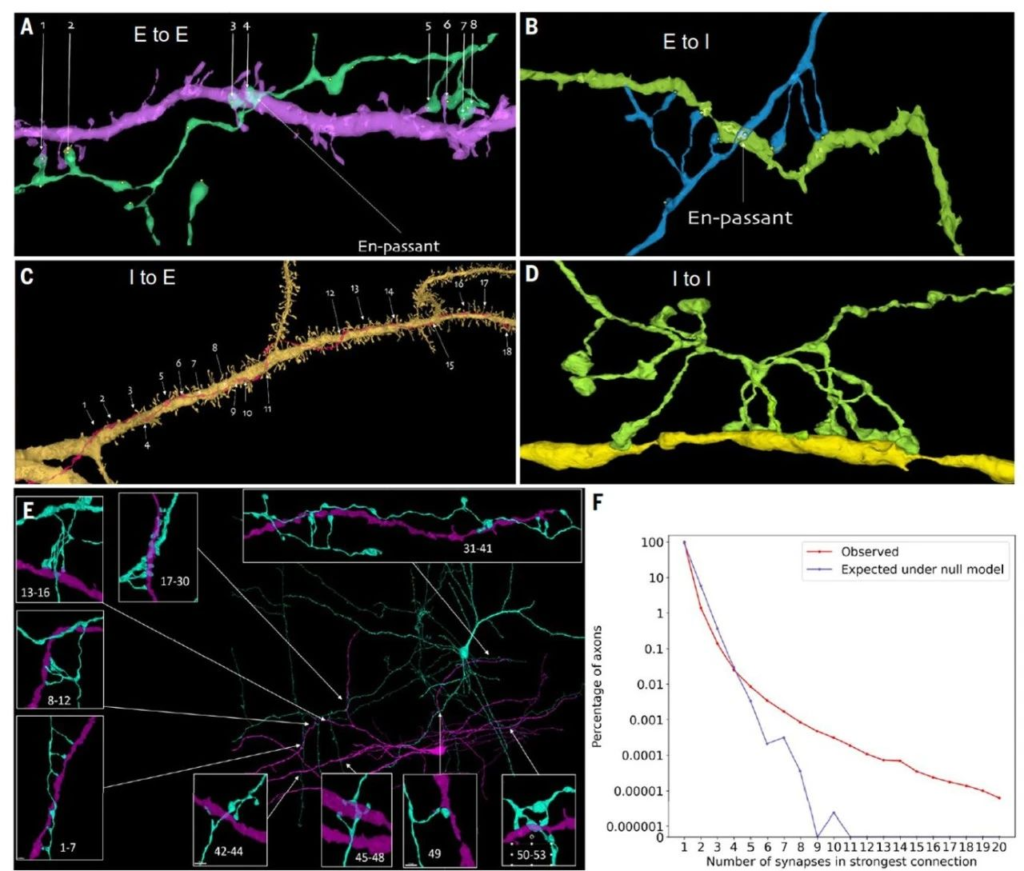
▷ Figure 4: Exceptionally strong synaptic connections in the human cerebral cortex.
Using nanoscale resolution to explore the six-layer structure of the human cortex, researchers revealed details of brain tissue at the cellular to subcellular level, investigating the complex relationships among neurons, synapses, glia, and blood vessels. Additionally, the authors provided several software tools, such as the browser-based Neuroglancer and its derivatives CREST and CAVE, as well as VAST, greatly facilitating data visualization and annotation.
However, the study has certain limitations. Fresh samples from healthy individuals are unlikely to be obtained through this neurosurgical approach. Although the patient’s temporal lobe did not show substantial pathological changes under light microscopy, long-term epilepsy or its drug treatment may have subtle effects on cortical tissue connectivity or structure.
Some unusual features were observed in this tissue, including some very large spines, axon varicosities filled with unusual substances, and a few axons forming extensive “axon helices.” It is currently unclear whether these rare structures are related to the disease or its treatment or are common features of the human brain. Comparing samples obtained from individuals with different underlying conditions will help us better understand these phenomena. Moreover, since the structure of the human cerebral cortex partly depends on past experiences, there is structural variability among individuals, but the extent of this variability is still unknown.
Considering the greater variability in human experience, behavior, and genetics, and the fact that humans and other vertebrates have many identified neuron categories rather than single identified neuron types, comparing neural circuits among human brains may be more challenging.